Functionality
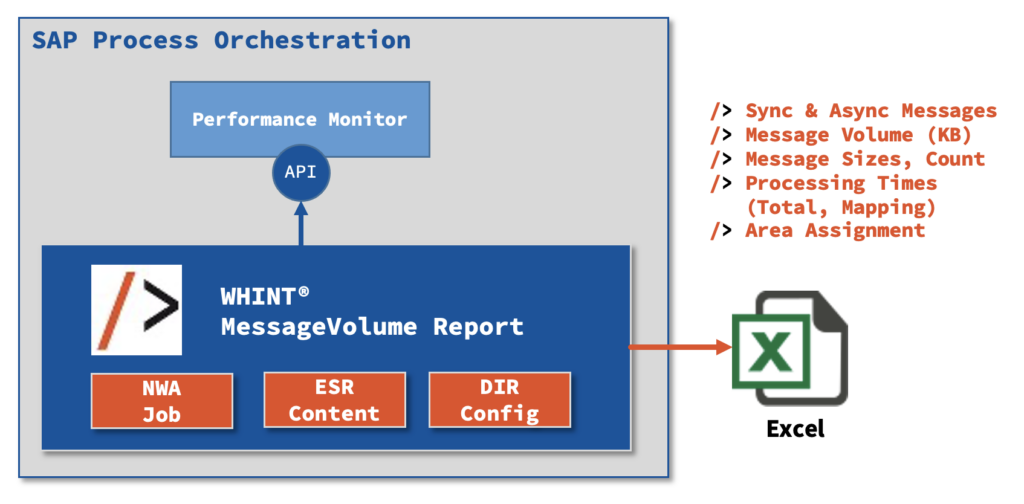
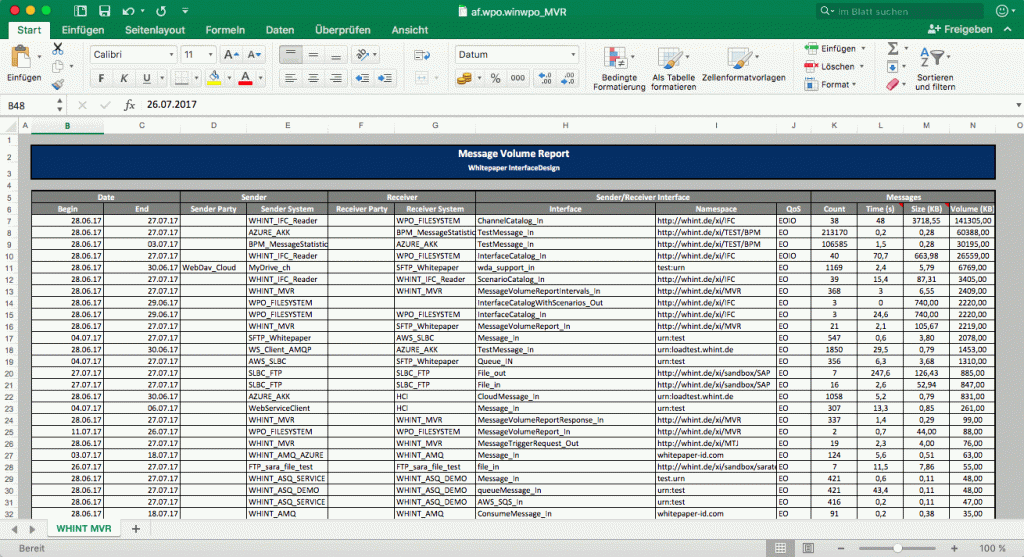
This solution reads the performance data of each Process Orchestration Adapter Engine and creates a report (monthly/weekly/daily) with the message volumes per Interface:
- Count (number of messages)
- Processing Times (total average processing time, average & maximum processing time for mapping and receiver adapter)
- Size (average message size, maximum message size)
- Volume (total message volume per interface)
- Quality of Service (BE/EO/EOIO)
- Direction (inbound/outbound)
- Sender (Party, Service)
- Receiver (Party, Service)
- Interface (with Namespace)
- Scenario (Integration Flow Name/Integrated Configuration)
- Retries (number of message processing retries as average and maximum)
Each Interface can be assigned to an area by maintaining a configuration file (e.g. all interfaces belonging to a subsidiary, brand or a specific scenario).
- Update (12.2021): Scenario, Retries & Receiver Adapter Duration
- Update (10.2018): Additional KPIs & simplification
- Update (03.2020): Daily Reporting by Hour
- Update (12.2021): Scenario, Retries, Receiver Adapter Processing Time

Prerequisites
- Works with SAP NetWeaver Process Orchestration version 7.3 EHP1 and higher
- If you read from more than one Adapter Engine and you enforce SSL, you need to apply SP15 for 7.31 / SP10 for 7.40
- Create a new User with the following standard role (or equivalent custom role): SAP_XI_MONITOR_J2EE
- Activate the performance monitoring in NWA
- Configuration > Infrastructure > Java System Properties
- Services > XPI Service: AF Core
- Properties > profile.performance.runtime = true
- Deploy WHINT MessageTrigger Job, which is part of the solution to trigger messages
- Import the Software Component into your ESR provided by Whitepaper InterfaceDesign
- Configure the Scenario by installing the Integration Scenario in NWDS (via iFlows) or in Integration Directory Swing Client
- Configure the interval to keep the last 45 days (at least 32) of the message processing by executing the following URL on your Process Orchestration system: http(s)://host:port/mdt/performancedataqueryservlet?PeriodConfig=DAILY=45
Usage
- Trigger the download of the WHINTMessageVolume Report using a trigger job
- Add a new task of type “MessageTriggerJob” and provide a name (e.g. WHINT_MessageVolumeReport)
- Set the ScenarioSender according to your Configuration Scenario (e.g. WHINT_MVR)
- Configure the report period in the MessageTrigger Job definition
- Param01: PERIOD=<reportingPeriod>
- The following reporting periods are possible:
- MONTH (default)
- LAST_MONTH
- WEEK (last 7 days)
- LAST_WEEK (since monday)
- Setup the area assignment like this in the Imported Archive “Lookup_XML”, file “Lookup_Area.xml”
- Area: Test1
- SenderSystem: Party_BC1 / SenderParty: Party1
- ReceiverSystem: System3 / ReceiverParty:
- Interface: Message_Out / InterfaceNS: urn:test
- Area: Test2
- SenderSystem: System4 / SenderParty:
- ReceiverSystem: Component2 / ReceiverParty:
- Interface: * / InterfaceNS: *
- Area: Test1
You can also trigger a test message (e.g. from PIMON with START and END as parameter and the dates in the format YYYY-MM-DD) using the MessageTriggerJob XML message format.
Example
The company (group) wants to distribute the costs for the SAP middleware operations across all (local) companies/subsidiaries based on the message volume they are using. Each month they execute a measurement and summarize the result into an Excel file.
The result can also be pushed into a BW data source (available on demand).


[…] You are interested in a smart overview of the messaging runtime data of your SAP PO Interface Landscape and would like to receive a MessageVolume Report with all your messages (e.g. per month) including Amount, Duration, Size and Volume? Then you need the WHINT MessageVolume Report. […]
[…] WHINT® MessageVolume Report […]