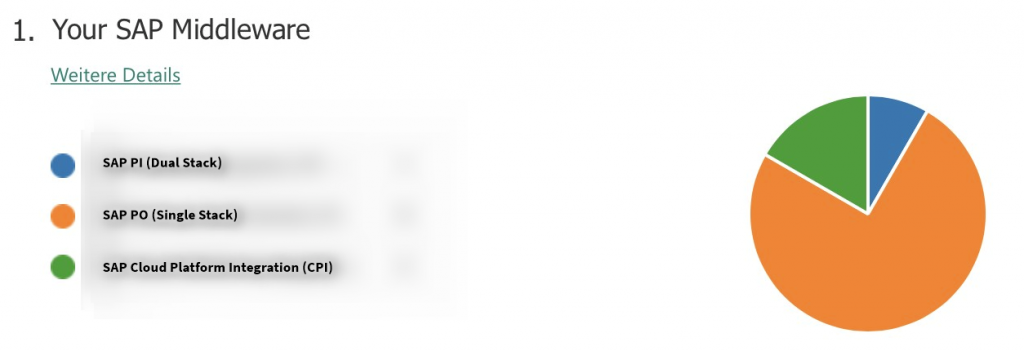
Please find the results of our survey below. As the list of participants was so low (less than 30 companies took part, which is quite disappointing), we will not host any online session.

2. The average of interfaces was 336, with a minimum of 30 and a maximum of 1500.
Here we see a strong difference regarding the type of interfaces. An A2A interface, built between SAP ERP and a custom warehouse, might require a different attention than a “standard” EDIFACT ORDERS to IDoc Mapping. B2B interfaces require their main attention (and development efforts) with regards to connectivity (URLs, certificates) and not so much in different mappings (as long as the messages exist already). To be able to compare the relevant interfaces properly, it is recommended to classify them by complexity and introduce a factor.
In addition, there is a difference between standard content (e.g. B2G scenarios like ELSTER for Germany or SII for Spain) and customer-specific interfaces. Moving files (MFT) is also a low effort scenario with pure connectivity requirements.
3. The average message processing per month was around 1,5 mio. messages
4. The average employee count was 2,6 (internal – min: 1, max: ) and 2,7 (external – min: 0, max: 10). Still not sure if the peak of 10 was a reliable source – w/out it would be 2,4 (external – min: 0, max: 6).
6. The ratio of outsourcing the middleware support is below 50% (41), however this question might not be clearly answered by all participants.
Overall, with this not very representative result, only vague tendencies can be provided with the result of some KPIs:
- Interfaces / Employee: 80 (rounded)
- Messages / Employee: 380.000 (rounded)
Based on our experience, this seems to be a realistic amount of interfaces which is managed by one person. However, even if you have 50 interfaces: one person can always be on vacation/sick/whatever, so having at least 2 experts around (internal or external) is key.
To calculate the proper ratio of interfaces per employee for yourself, you should consider the following criteria and factors (those are suggestions only of course which are based on our customer and project experience):
- Customer-specific Interface (A2A/B2B/B2G): Factor 1-2 (depending on complexity such as BPM, Lookup usage)
- Standard Integration Content (A2A/B2B/B2G): Factor 0,25 (mainly connectivity)
- Managed File Transfer (MFT): Factor 0,1 (just NFS/(S)FTP connectivity)
- EDI-B2B Integration (EDIFACT/ANSI X.12): Factor 2 for the first message mapping (e.g. X.12 410 -> ORDERS05), then Factor 0,25 for each additional partner (mainly connectivity)
Sample Calculation:
- 50 normal A2A interfaces => 50 (factor 1)
- 20 complex A2A interfaces => 40 (factor 2)
- 40 B2G interfaces (ELSTER, SII) => 10 (factor 0,20)
- 30 MFT interfaces => 3 (factor 0,1)
- 200 EDI interfaces (40 partners with 5 messages each, covering 2 standards EDIFACT & ANSI X.12) => 20 for the 5 messages of 2 standards for 2 partners (factor 2) plus 48 for the remaining 38 partners with 5 messages each (factor 0,25)
Here, the 340 interfaces are weighted by complexity into 171 interfaces, which would lead to having 2-3 employees to properly manage the middleware landscape.


[…] Team Staffing […]