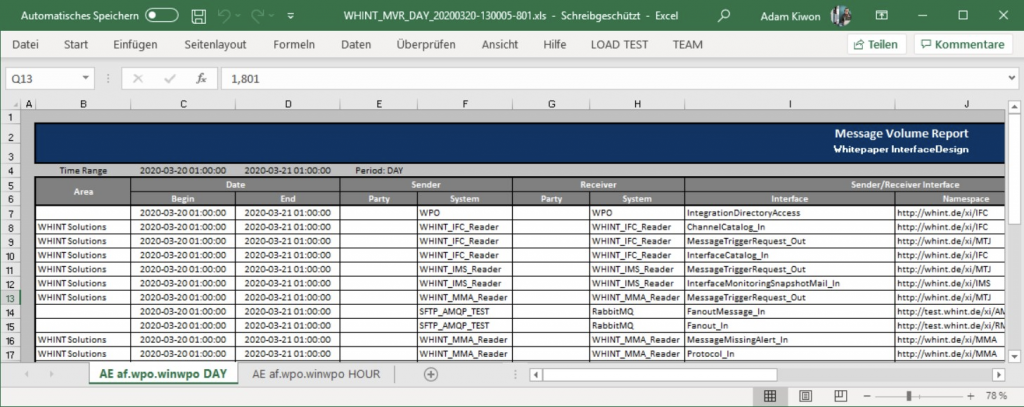
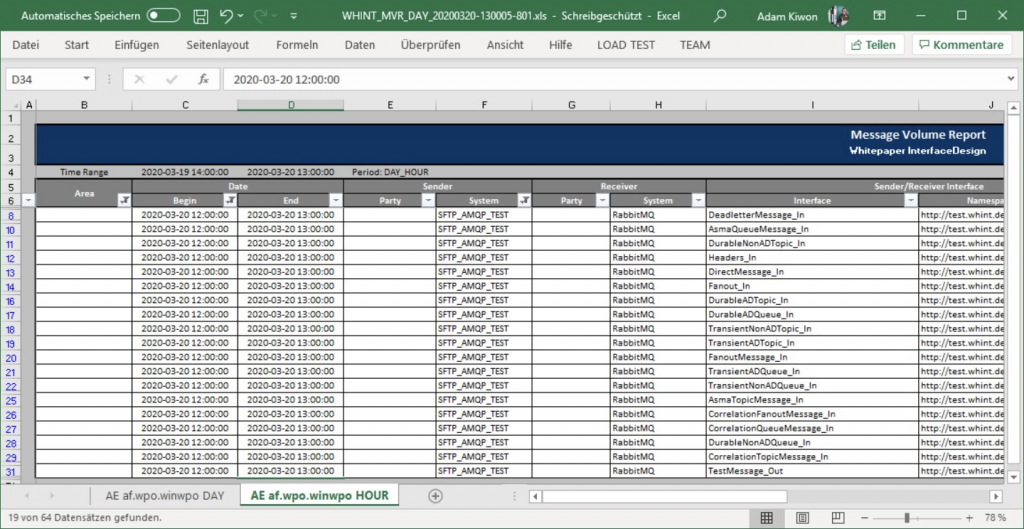
This update for WHINT MessageVolume Report for SAP Process Orchestration allows you to monitor the aggregated messages per hour on top of the existing daily/weekly/monthly messaging. It helps to show the messaging distribution of the day to analyze the traffic. Tab 1 shows the aggregated messages of the day (AE <runtime> DAY) and Tab 2 shows the messages by hour (AE <runtime> HOUR).
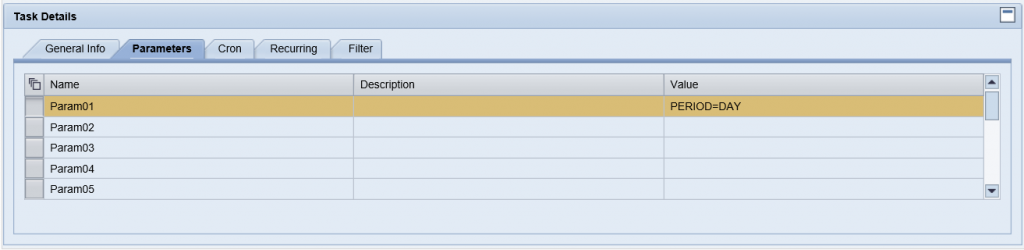
Job Configuration
Result
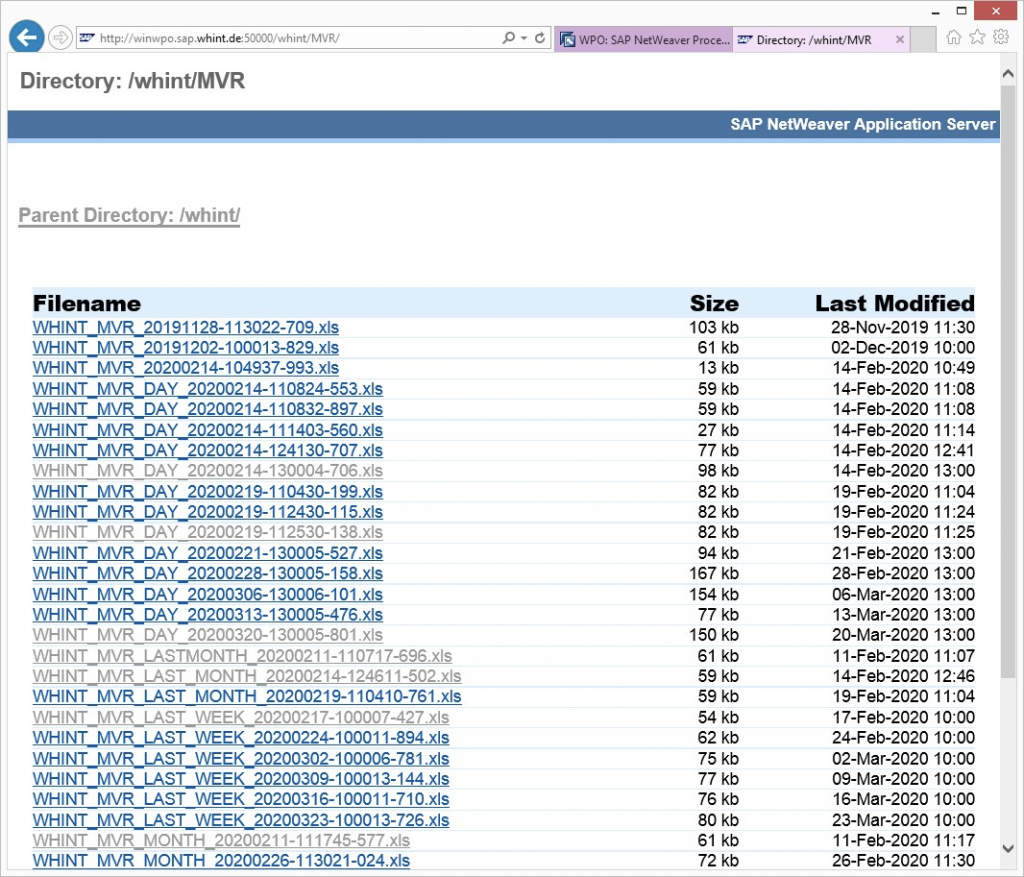
In additon, the generated file names now contain the configured period: